Most statistical studies are based on a sample of the population at large, as suggested in the following diagram.
It might be asked why rely on a sample rather than collecting data from the entire population. The usual answers to this are a lack of either financial or logistical feasibility. For example, Krabbe disease is extremely expensive to screen for, rendering the testing of everyone in Atlanta for the disease completely financially unreasonable. Also testing everyone in California for HIV would be impossible, due to – among other factors – the general flow of people from place to place. The national effort to eradicate polio in the US in the early 1960s stands as a great example of how hard it is to coordinate any effort to reach every member of a large, diverse population.
Thus if we wish to, say, find out what fraction of mosquitoes in a region carry malaria we would be more effective at our task if we took a sample of the mosquito population and inferred features about the population as a whole. But to get an accurate picture of this mosquito question, it would be silly to only test mosquitoes in a desert region, or only test in a swamp. Neither will tend to give an accurate understanding of the underlying mosquito population. Such distortions in data are called sample bias. Instead we would do well to pick a mechanism for collecting data which gives every member of the population a chance of being selected which is equal to its likelihood to occur in the population as a whole. Such a sampling procedure is called random sampling.
Sample Bias is a distortion in how data is collected, favoring some outcomes at the expense of others.
Random Sampling is a method of data collection which gives each possible outcome a likelihood of occurring equal to its occurrence in the population as a whole.
Thus if we wish to understand literacy in Mississippi we should not restrict our sampling to urban white communities. If we wish to understand use of gasoline we should not restrict our sampling to regional sales representatives of pharmaceuticals corporations.
Random sampling is desired in order for the mathematical treatment (soon to follow) to offer accurate inference. There is a substantial literature on methods and techniques of random sampling. Here we will mention a bit of this.
Techniques of Random Sampling
There are various ways to gather random samples. Here we mention two such.
Simple Random Sampling
This is a method in which every member of a population has an equal chance of being chosen. For example, if our population is the people at a sporting event we could put their social security numbers on pingpong balls in a giant tumbler and spin the tumbler repeatedly while taking one ball out at a time. This is the principle behind lottery games.
Spreadsheets have built in randomization functions operating on this principle. The function RAND in most spreadsheets will produce a number between $0$ and $1\;$ . Thus in the example below we see in cells A2 through A11 the results of “=RAND()”. We can modify this to obtain a random value between $0$ and $4$ simply by multiplying by $4\;$ . The results of “=4*RAND()” are displayed in cells C2 through C11 below. If we add $1$ to this function we get random values between $1$ and $5$, and the results “=4*RAND()+1” are shown in cells E2 through E11. Further modification allows us to restrict to the integers $1\,$ , $\, 2\,$ , $\, 3\,$ , and $4\,$ : “=FLOOR(4*RAND()+1)” rounds down to the nearest lower integer, as displayed in cells G2 through G11.
Click here to open a copy of this so you can experiment with it. You will need to be signed in to a Google account.
Systematic Sampling
To avoid personal bias when selecting people at random, it is common to select every $\displaystyle{ k^{\rm th} }$ member of a population. Here $k$ is chosen to yield the size of sample desired. Thus if we have a population of size $10,000$ and want a sample of size $50\,$ , we would select every two-hundredth ( $\, \displaystyle{ k=200 =\frac{\text{population size}}{\text{desired sample size}} }\,$ ) member of the population. Listing the members of a population on cards, shuffling the cards, and then selecting every two-hundredth card to pick define the sample would give us a systematic sample of the desired size.
One way to shuffle within spreadsheets is by a clever use of the RAND function. Here is an example of such. Suppose we have twenty items, in cells A1 through A20, which we wish to shuffle. Enter “=RAND()” into cells B1 through B20. Next select cells A1 through B20 and select “DATA > Sort > Column B > Ascending” from the overhead menu. This will result in a random shuffling of the entries of column A. The following spreadsheet renders the random values static and illustrates the shuffle in columns D and E. You can try this with the downloadable example. It will tend to change the values in column B, but that is not of concern for our shuffling.
Click here to open a copy of this so you can experiment with it. You will need to be signed in to a Google account.
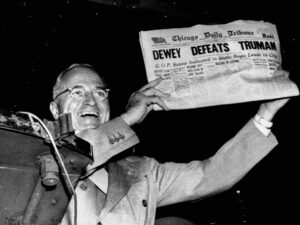
Examples of poor sampling techniques are readily available in politics. Shown below is a famous picture of President Harry Truman, having just won the national election against New York Governor Thomas Dewey, holding up a newspaper proclaiming “DEWEY DEFEATS TRUMAN”. A Gallup poll had predicted the previous evening that Dewey would win, but had not accounted for a large number of undecided voters. It was a mistake to assume that they were well-represented by decided voters, favoring Dewey.